Please review the Quantiles Tutorial.
The accuracy of a quantile sketch is a function of the configured value k, which also affects the overall size of the sketch.
Accuracy for quantiles sketches is specified and measured with respect to the rank only, not the values.
The Quantiles/DoublesSketch and the KLL Sketch have absolute error. For example, a specified accuracy of 1% at the median (rank = 0.50) means that the true value (if you could extract it from the set) should be between getQuantile(0.49) and getQuantile(0.51). This same 1% error applied at a rank of 0.95 means that the true value should be between getQuantile(0.94) and getQuantile(0.96). In other words, the error is a fixed +/- epsilon for the entire range of rank values.
The ReqSketch, however, has relative rank error and the user can choose which end of the rank domain should have high accuracy. Refer to the sketch documentation for more information.
A sketch is an implementation of a streaming algorithm. By definition, a sketch has only one chance to examine each item of the stream. It is this property that makes a sketch a streaming algorithm and useful for real-time analysis of very large streams that may be impractical to actually store.
We also assume that the sketch knows nothing about the input data stream: its length, the range of the values or how the values are distributed. If the authors of a particular algorithm require the user to know any of the above attributes of the input data stream in order to “tune” the algorithm, the algorithm is not data independent.
The only thing the user needs to know is how to extract the values from the stream so that they can be fed into the sketch. It is reasonable that the user knows the type of values in the stream: e.g., are they alphanumeric strings, numeric strings, or numeric primitives. These properties may determine the type of sketch to use as well as how to extract the appropriate quantities to feed into the sketch.
A k of 256 produces a normalized rank error of less than 1%. For example, the median value returned from getQuantile(0.5) will be between the actual values from the hypothetically sorted array of input values at normalized ranks of 0.49 and 0.51, with a confidence of about 99%.
The approximate error (epsilon) values listed in the second row of the header in the table below can be computed using the function double DoubleSketch.getNormalizedRankError(int k). The values in this table match very closely with empirical measurements up to k = 1024 at the 99% confidence level. Beyond k = 1024, the estimated error is somewhat speculative, but should be reasonable guidance. These error values simultaneously apply to all half-open intervals (-Infinity, Q] and closed intervals [Q1, Q2].
Table Guide for Quantiles DoublesSketch Size in Bytes and Approximate Error:
          K => |        16        32        64       128       256       512     1,024     2,048     4,096     8,192    16,384    32,768
    ~ Error => |   12.145%    6.359%    3.317%    1.725%    0.894%    0.463%    0.239%    0.123%    0.063%    0.033%    0.017%    0.009%
             N | Size in Bytes ->
----------------------------------------------------------------------------------------------------------------------------------------
             0 |         8         8         8         8         8         8         8         8         8         8         8         8
             1 |        64        64        64        64        64        64        64        64        64        64        64        64
             3 |        64        64        64        64        64        64        64        64        64        64        64        64
             7 |        96        96        96        96        96        96        96        96        96        96        96        96
            15 |       160       160       160       160       160       160       160       160       160       160       160       160
            31 |       288       288       288       288       288       288       288       288       288       288       288       288
            63 |       416       544       544       544       544       544       544       544       544       544       544       544
           127 |       544       800     1,056     1,056     1,056     1,056     1,056     1,056     1,056     1,056     1,056     1,056
           255 |       672     1,056     1,568     2,080     2,080     2,080     2,080     2,080     2,080     2,080     2,080     2,080
           511 |       800     1,312     2,080     3,104     4,128     4,128     4,128     4,128     4,128     4,128     4,128     4,128
         1,023 |       928     1,568     2,592     4,128     6,176     8,224     8,224     8,224     8,224     8,224     8,224     8,224
         2,047 |     1,056     1,824     3,104     5,152     8,224    12,320    16,416    16,416    16,416    16,416    16,416    16,416
         4,095 |     1,184     2,080     3,616     6,176    10,272    16,416    24,608    32,800    32,800    32,800    32,800    32,800
         8,191 |     1,312     2,336     4,128     7,200    12,320    20,512    32,800    49,184    65,568    65,568    65,568    65,568
        16,383 |     1,440     2,592     4,640     8,224    14,368    24,608    40,992    65,568    98,336   131,104   131,104   131,104
        32,767 |     1,568     2,848     5,152     9,248    16,416    28,704    49,184    81,952   131,104   196,640   262,176   262,176
        65,535 |     1,696     3,104     5,664    10,272    18,464    32,800    57,376    98,336   163,872   262,176   393,248   524,320
       131,071 |     1,824     3,360     6,176    11,296    20,512    36,896    65,568   114,720   196,640   327,712   524,320   786,464
       262,143 |     1,952     3,616     6,688    12,320    22,560    40,992    73,760   131,104   229,408   393,248   655,392 1,048,608
       524,287 |     2,080     3,872     7,200    13,344    24,608    45,088    81,952   147,488   262,176   458,784   786,464 1,310,752
     1,048,575 |     2,208     4,128     7,712    14,368    26,656    49,184    90,144   163,872   294,944   524,320   917,536 1,572,896
     2,097,151 |     2,336     4,384     8,224    15,392    28,704    53,280    98,336   180,256   327,712   589,856 1,048,608 1,835,040
     4,194,303 |     2,464     4,640     8,736    16,416    30,752    57,376   106,528   196,640   360,480   655,392 1,179,680 2,097,184
     8,388,607 |     2,592     4,896     9,248    17,440    32,800    61,472   114,720   213,024   393,248   720,928 1,310,752 2,359,328
    16,777,215 |     2,720     5,152     9,760    18,464    34,848    65,568   122,912   229,408   426,016   786,464 1,441,824 2,621,472
    33,554,431 |     2,848     5,408    10,272    19,488    36,896    69,664   131,104   245,792   458,784   852,000 1,572,896 2,883,616
    67,108,863 |     2,976     5,664    10,784    20,512    38,944    73,760   139,296   262,176   491,552   917,536 1,703,968 3,145,760
   134,217,727 |     3,104     5,920    11,296    21,536    40,992    77,856   147,488   278,560   524,320   983,072 1,835,040 3,407,904
   268,435,455 |     3,232     6,176    11,808    22,560    43,040    81,952   155,680   294,944   557,088 1,048,608 1,966,112 3,670,048
   536,870,911 |     3,360     6,432    12,320    23,584    45,088    86,048   163,872   311,328   589,856 1,114,144 2,097,184 3,932,192
 1,073,741,823 |     3,488     6,688    12,832    24,608    47,136    90,144   172,064   327,712   622,624 1,179,680 2,228,256 4,194,336
 2,147,483,647 |     3,616     6,944    13,344    25,632    49,184    94,240   180,256   344,096   655,392 1,245,216 2,359,328 4,456,480
 4,294,967,295 |     3,744     7,200    13,856    26,656    51,232    98,336   188,448   360,480   688,160 1,310,752 2,490,400 4,718,624
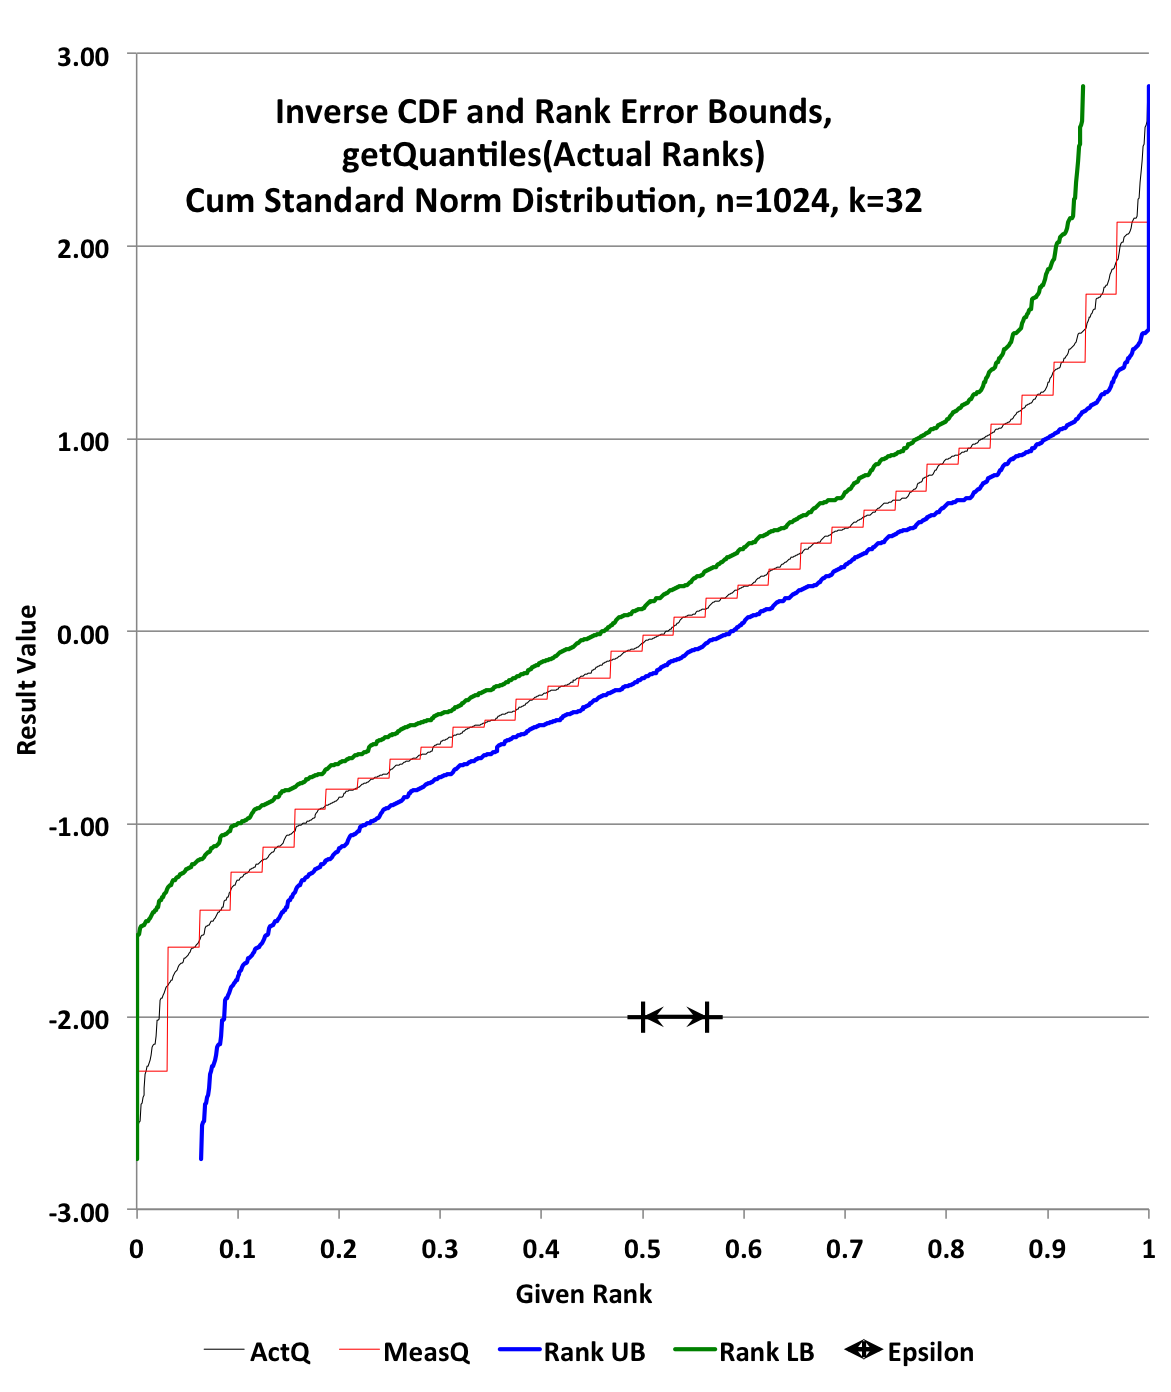
The following graphs illustrate the ability of the Quantiles DoublesSketch to characterize value distributions.
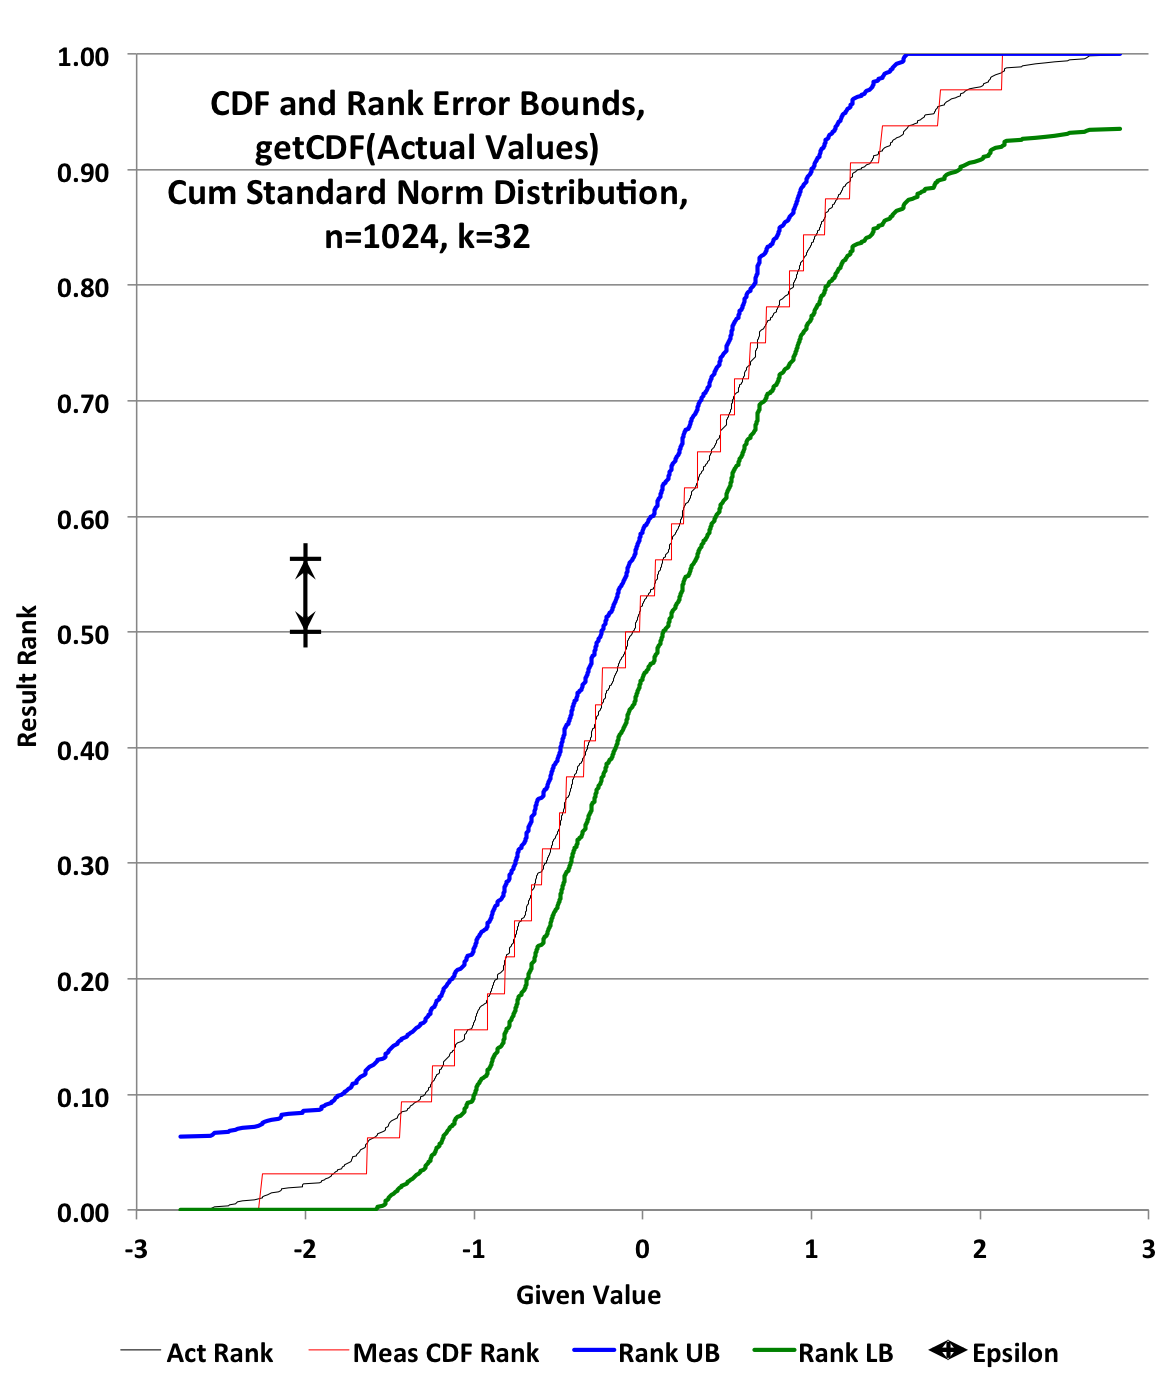
1024 (n) values (trueUnsortedValues) were generated from Random’s nextGaussian(). These values were then sorted (trueSortedValues) and assigned their true normalized ranks (trueRanks) from 0 to (n-1)/n.
A DoublesSketch (sketch) was then created with K = 32 and updated with the trueUnsortedValues.
sketch.getCDF(trueSortedValues) produced an ordered array of estimated ranks (estimatedRanks) . The estimatedRanks (red) were then plotted against the trueRanks (black). The upper bound error was plotted in blue and the lower bound error was plotted in green.
The error of the estimation from the sketch is called “Epsilon” and is always with respect to the rank axis. It was plotted as a visual bar on the graph to illustrate its size.
The size of this sketch, if stored, would be about 1832 bytes.


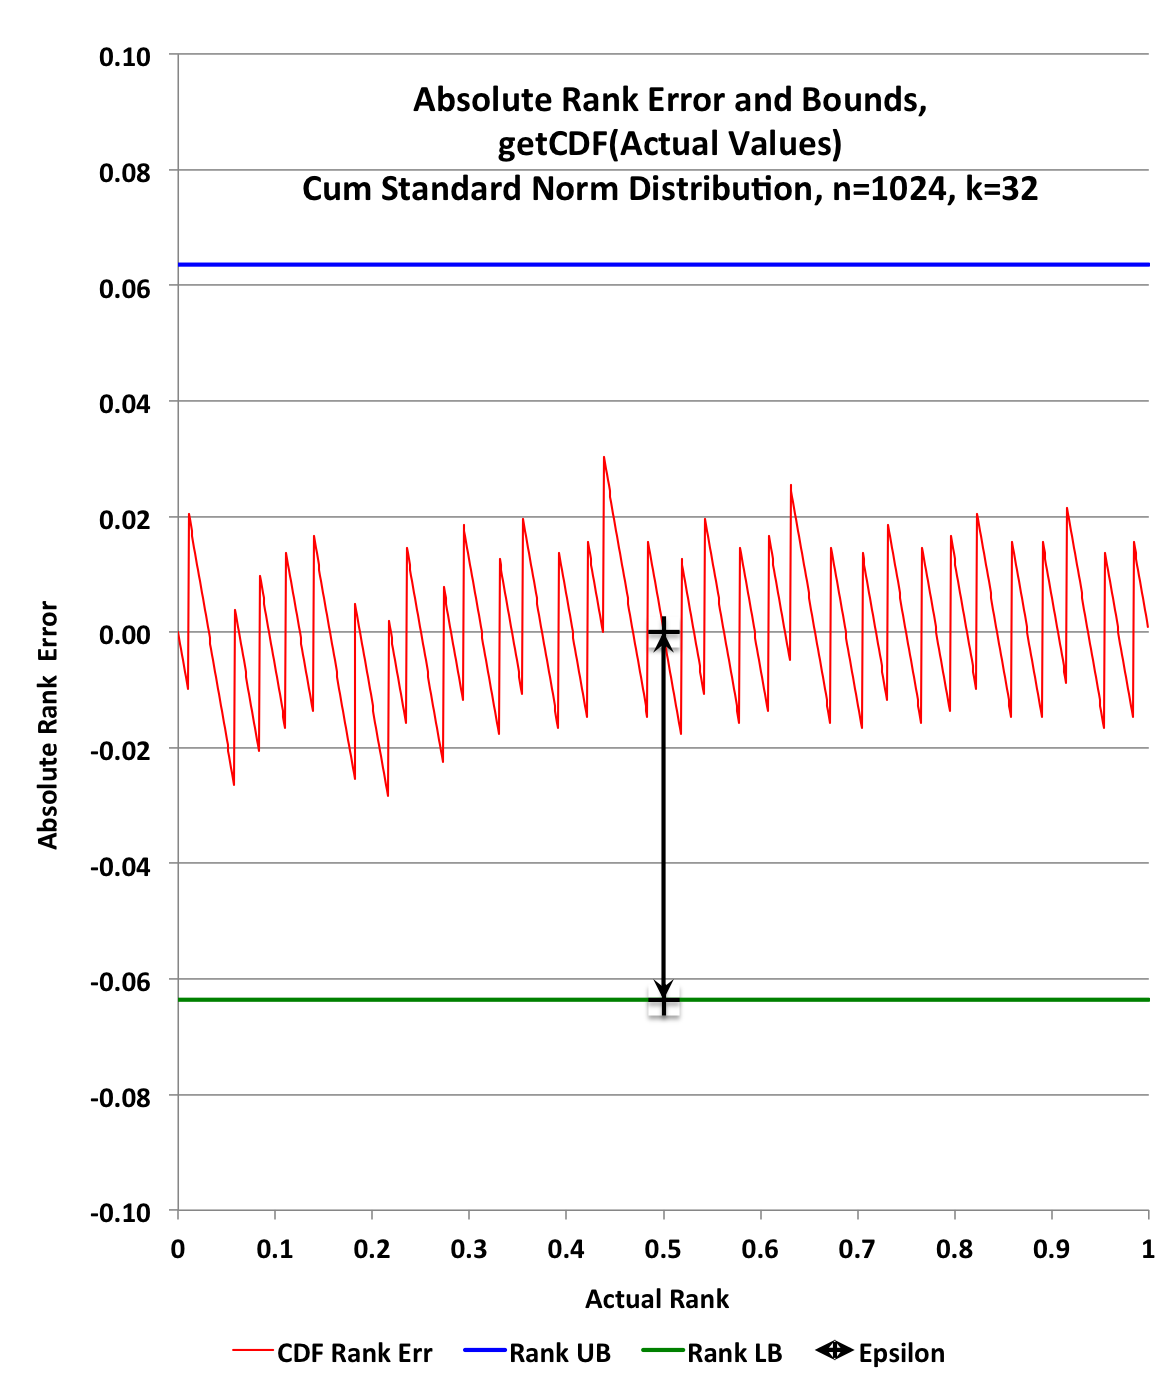
The absolute rank error vs the trueRanks produced the following graph.

All of the above plots were generated from one trial, and is not a test of the error bounds.
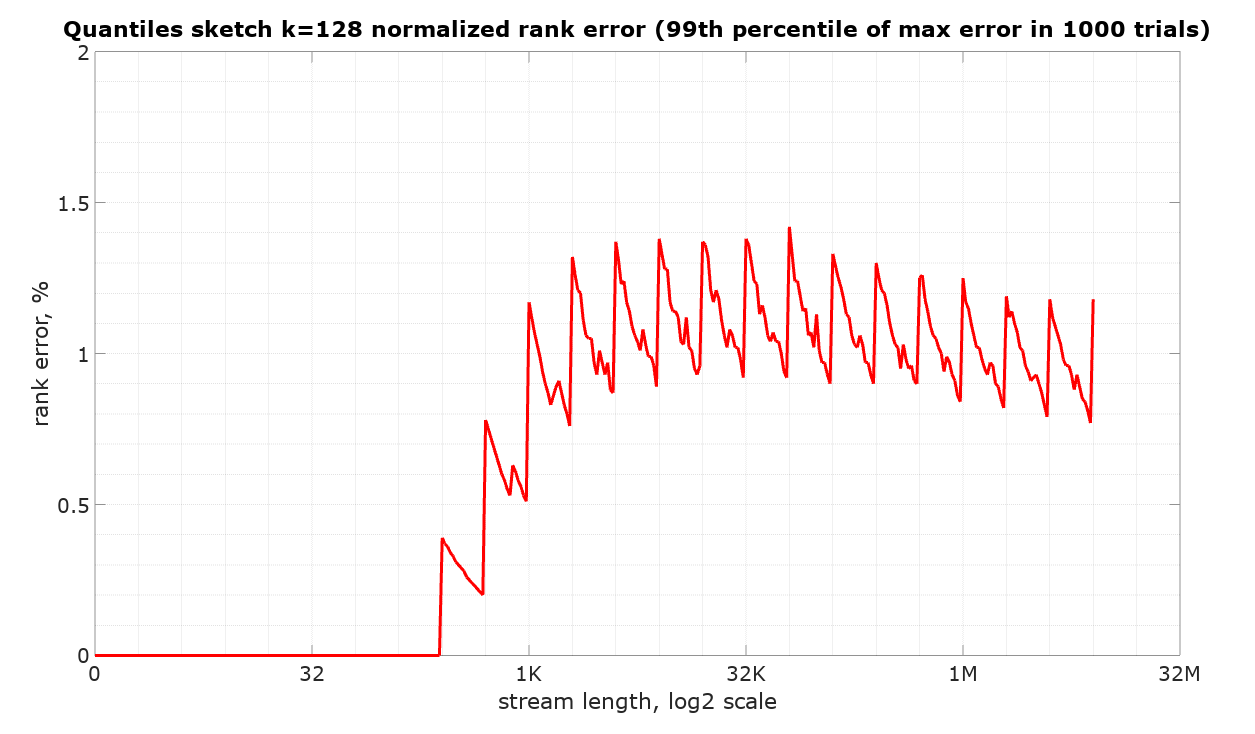
The following plot illustrates the 99th percentile of observed maximum normalized rank error of DoublesSketch with k=128 in 1000 trials at each stream length. The code to reproduce this measurement is available in the DataSketches/characterization repository. Note that these measurements are not directly comparable to the values in the table above as this graph plots the error for only the half-open intervals (-Infinity, Q], which is relevant to simple queries such as getRank(value).
