The goal of this article is to do an objective comparison of the KLL quantiles sketch implemented in this library and the t-digest.
Consider the stream of n values presented to the sketch. The rank of a value would be its index in the sorted version of the input stream. If we divide the rank by n, it becomes the normalized rank, which is between 0 and 1. Suppose a particular value x is repeated several times. There is a range of ranks in the hypothetical sorted stream that might be assigned to x:
KLL sketch uses the min rule. If one value is added to the sketch (even repeatedly), its rank is 0.
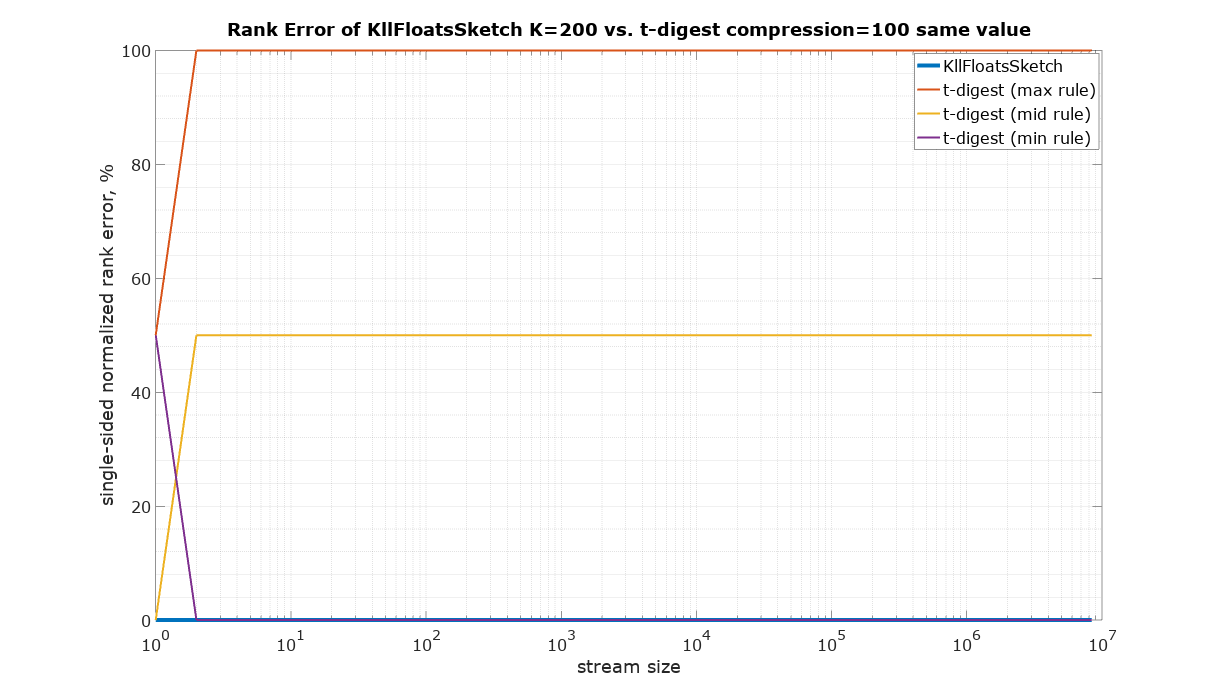
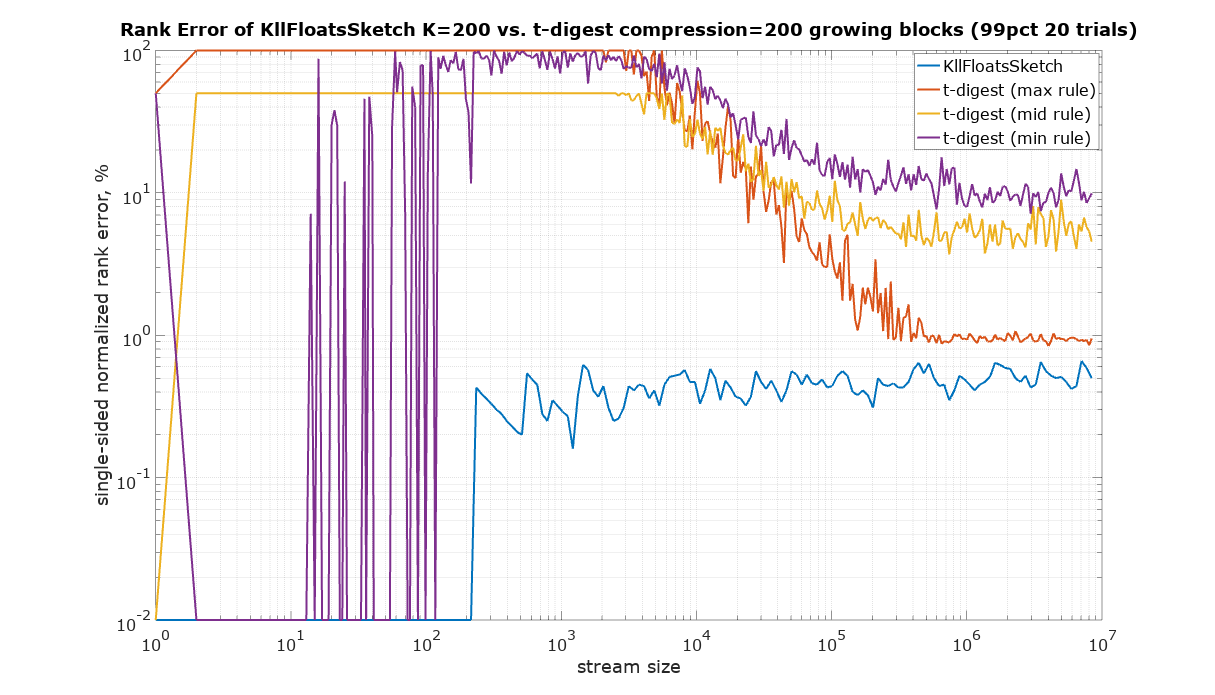
It is not clear what rule t-digest uses. There is a discrepancy between the definition of rank in Javadoc and the implementation. The definition reads (above cdf(x) method in TDigest.java): “returns the fraction of all points added which are <= x”. This would be the max rule. However, there is a helping method in tests that implements the mid rule. Moreover, experiments with streams of the same repeated value show that the min rule might explain the results better (see the plot below), but not exactly. For completeness the comparison was done using all tree rules for t-digest.
This plot is to validate the basic assumptions about the sketches. The same repeated value was used as the input. The expected rank error is 0%.
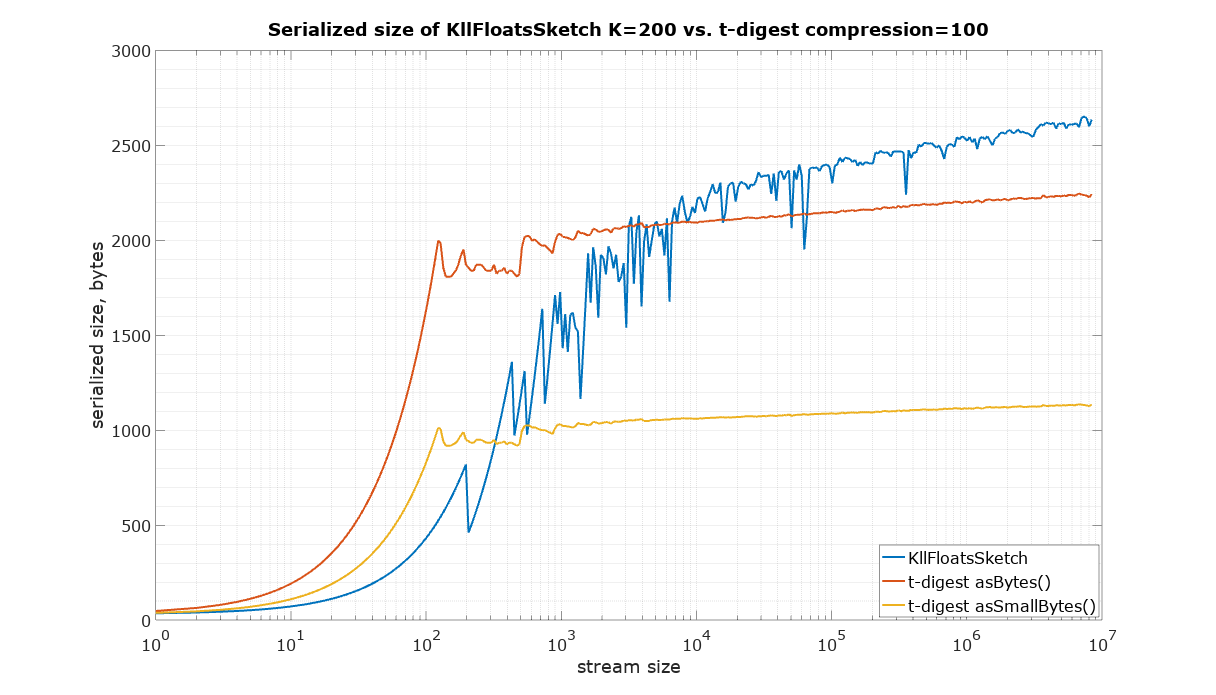
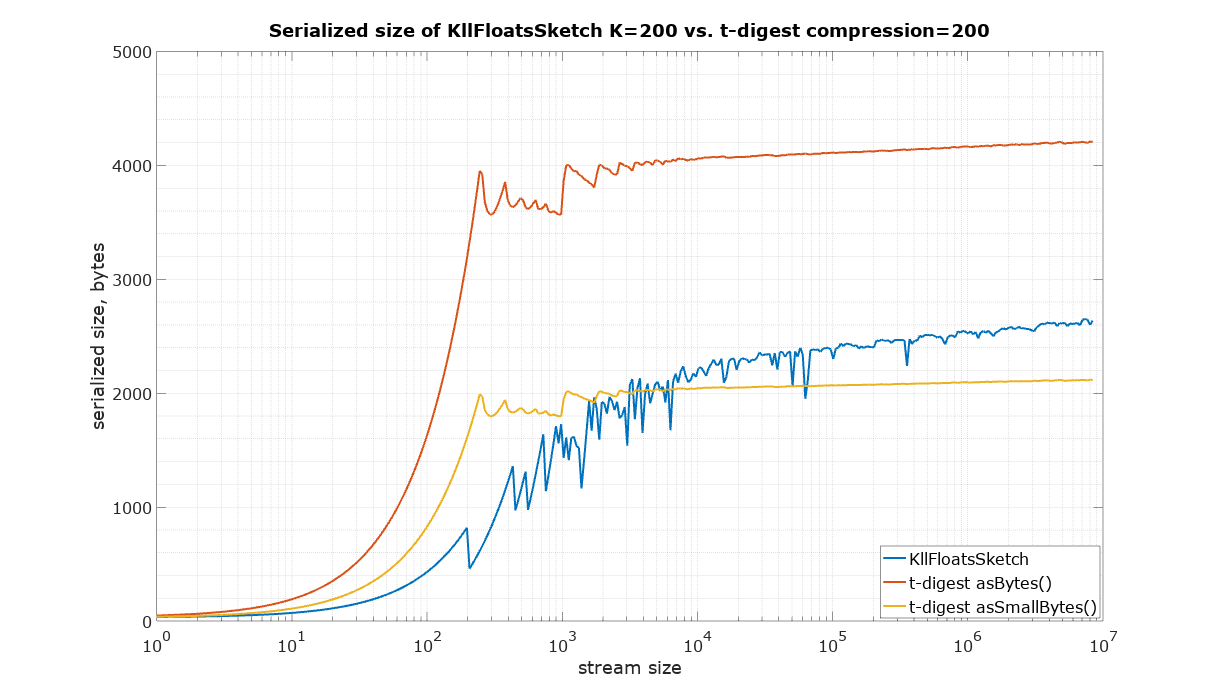
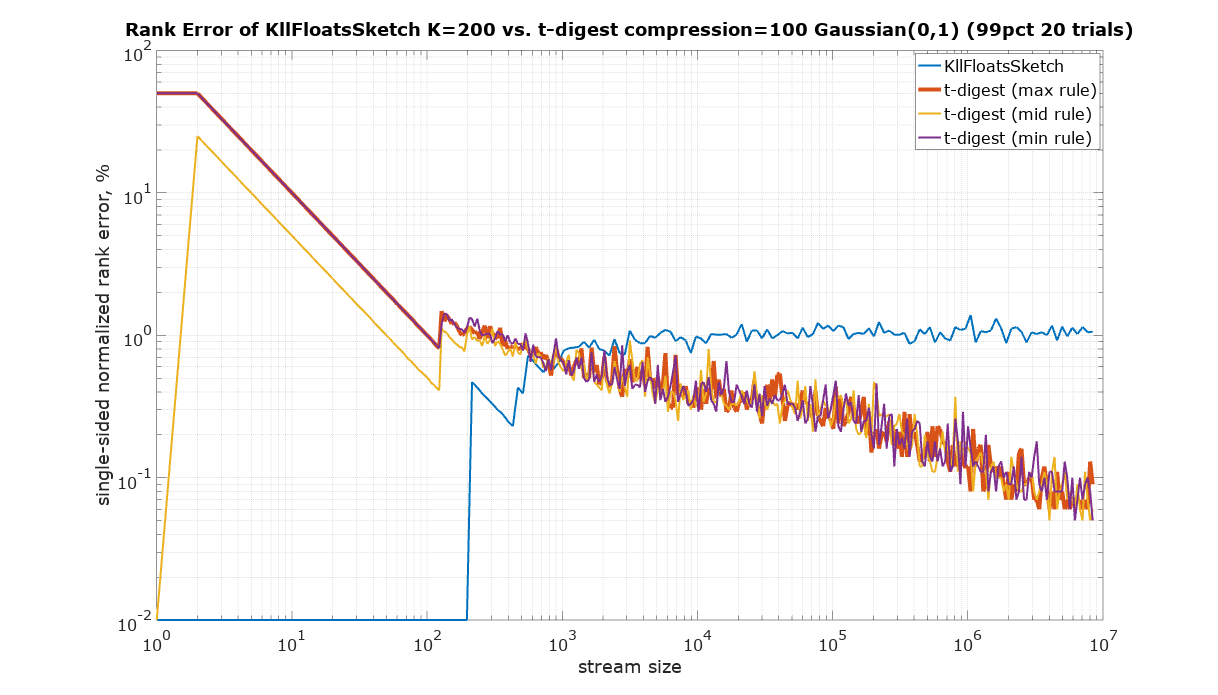
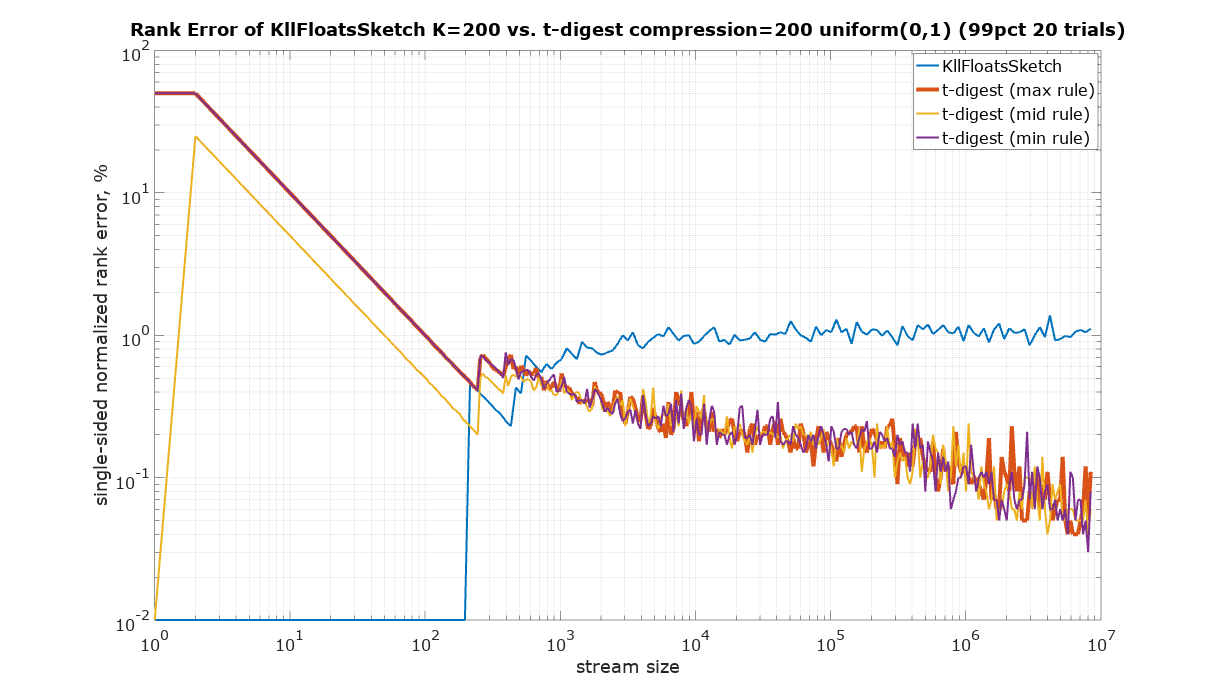
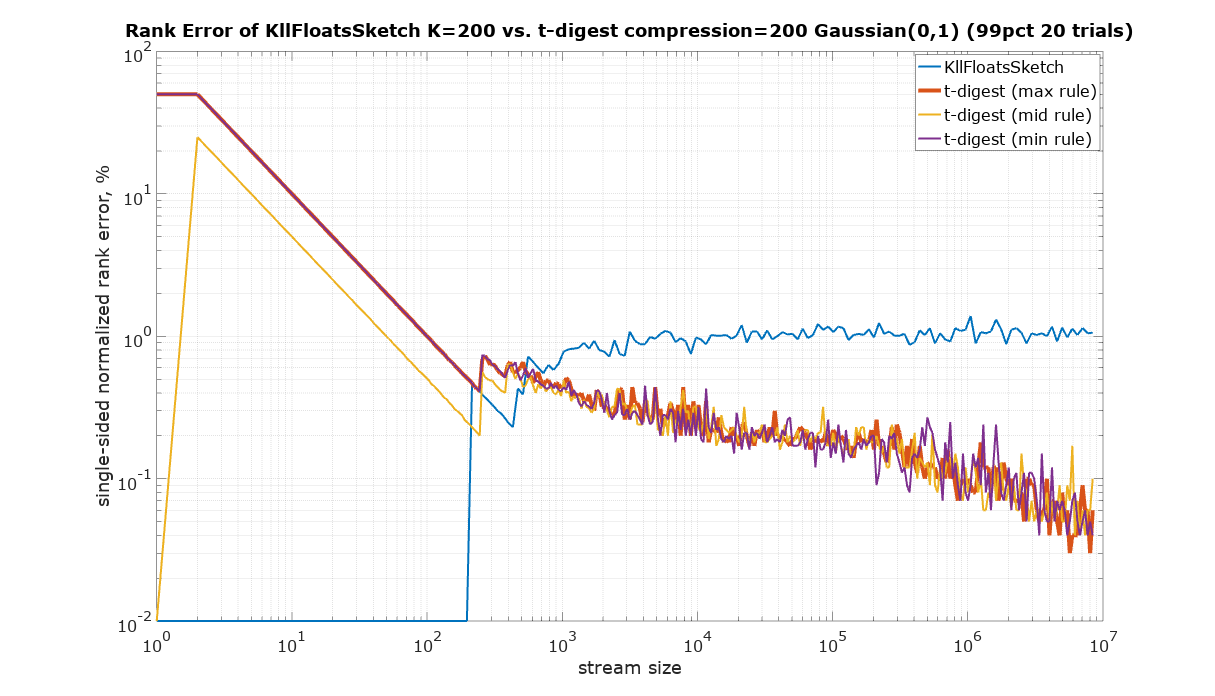
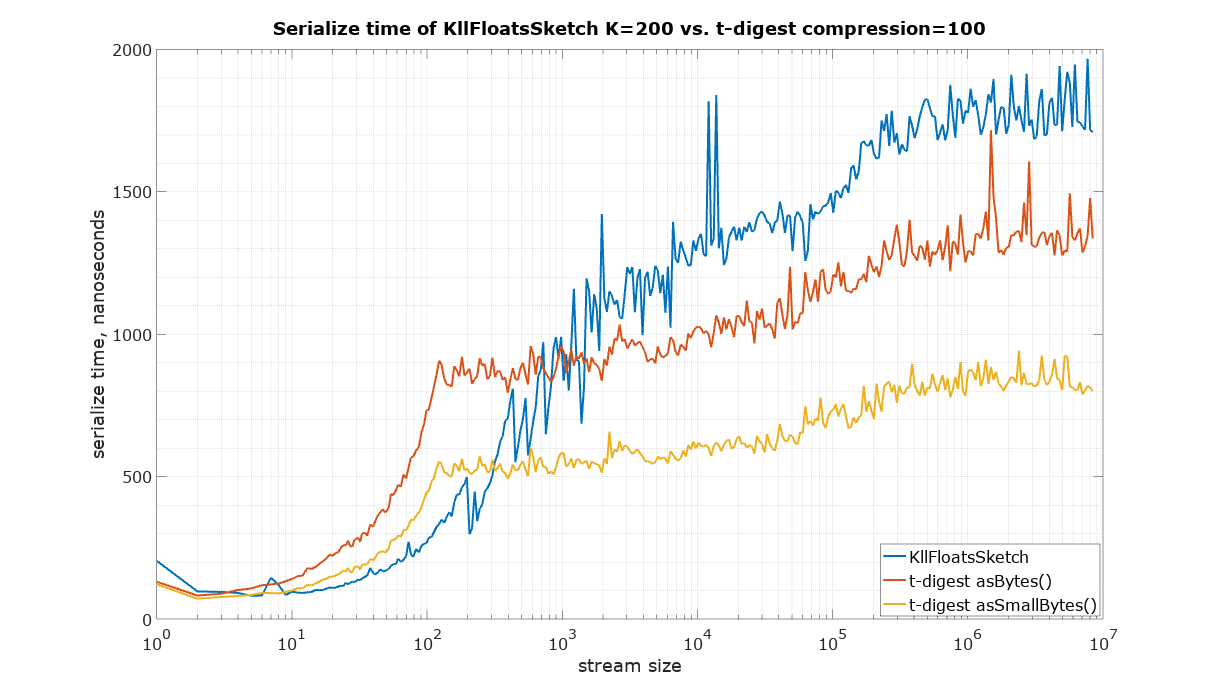
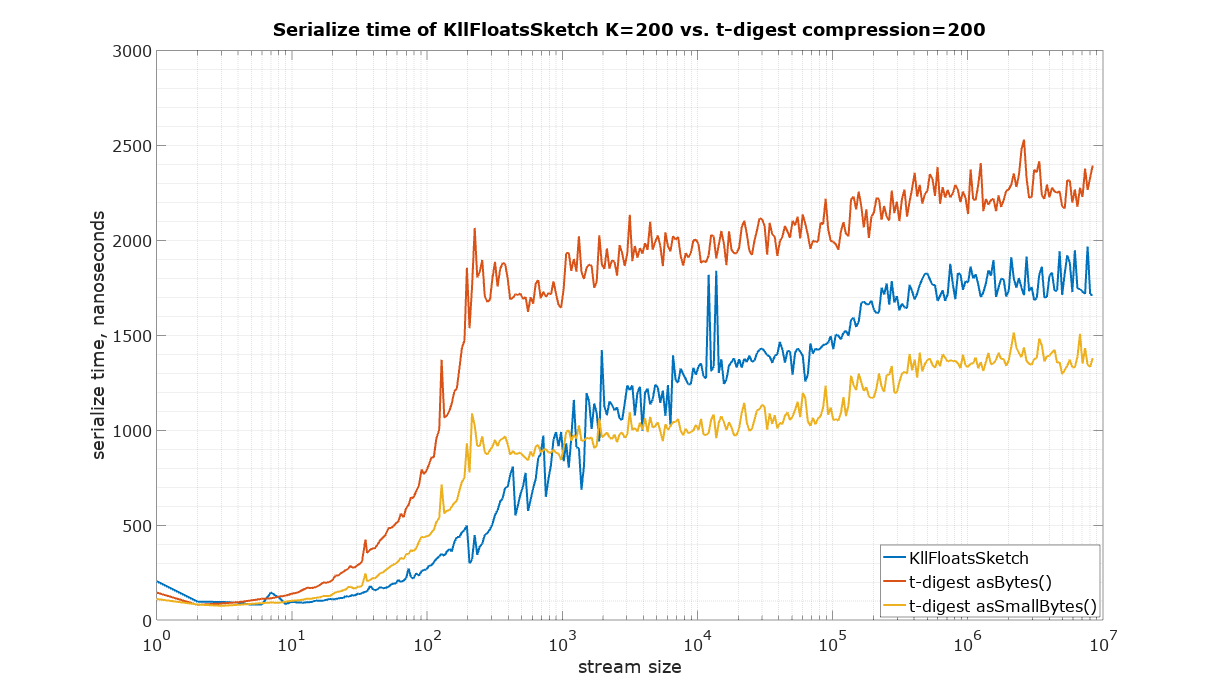
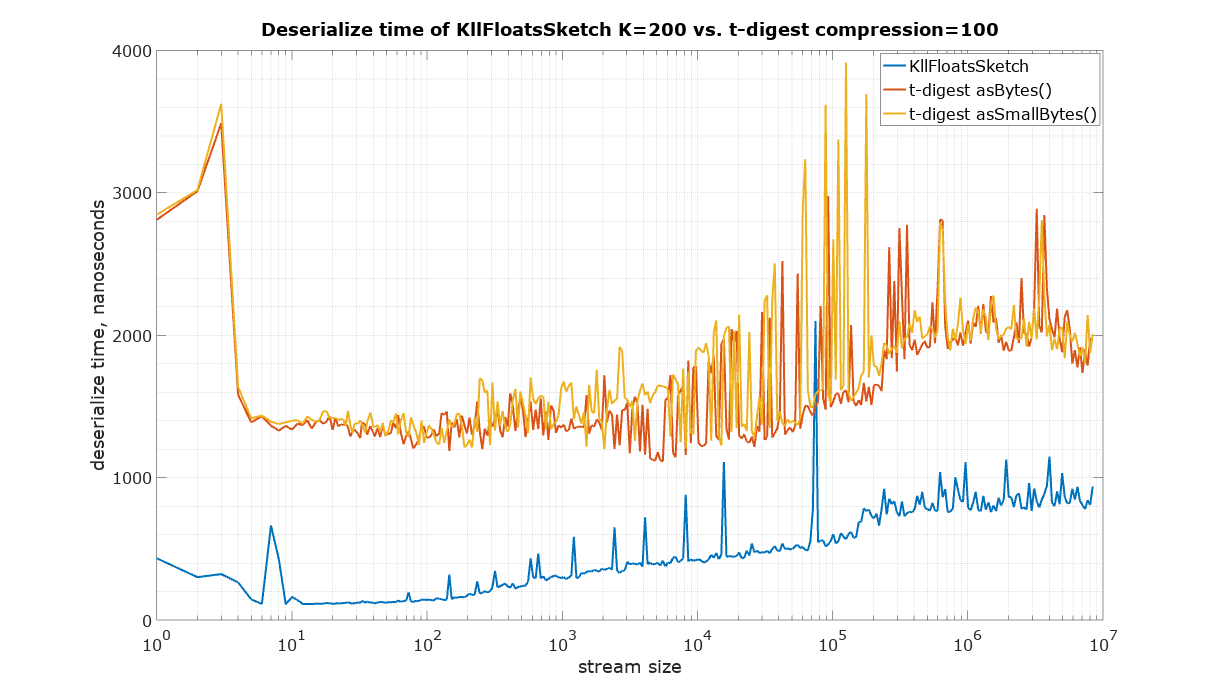
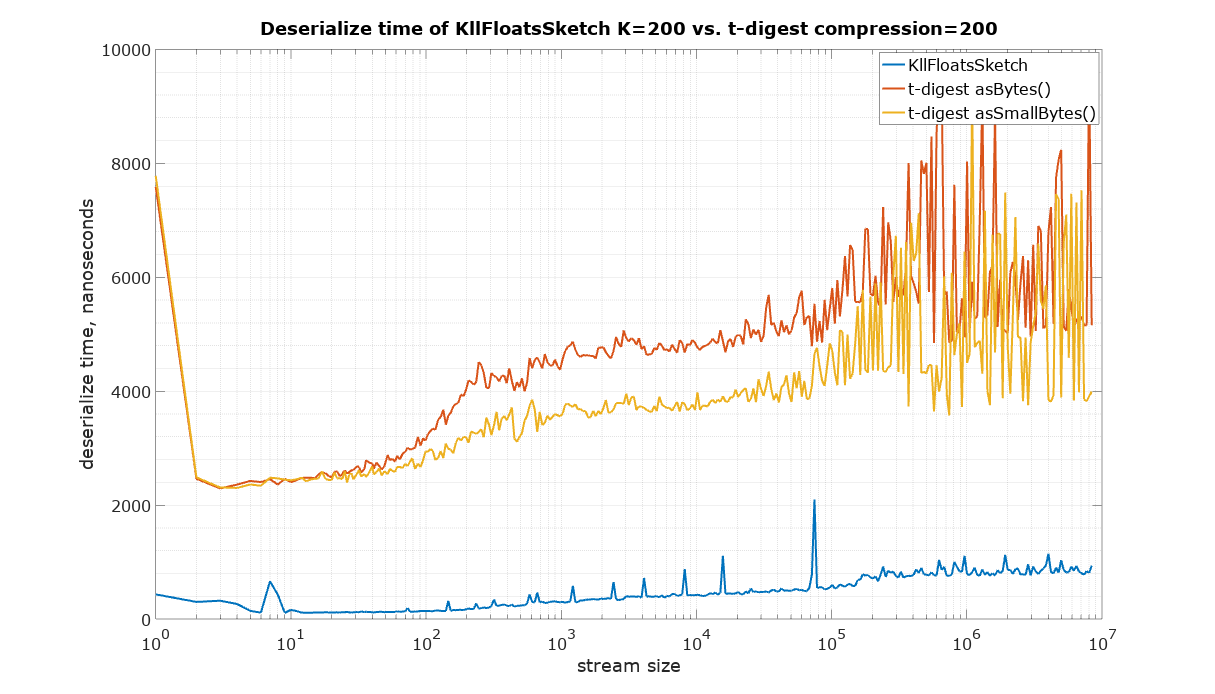
The starting point in this comparison is a choice of parameters for KLL sketch and t-digest in such a way that they have approximately the same size. It is quite difficult to measure the size of a Java object in memory, therefore the serialized size was used as the best available measure of size, which is also important for many practical applications in large systems. There are two ways to serialize t-digest: asBytes() and asSmallBytes(). It was found that t-digest with compression=100 (recommended in the documentation) approximately matches the size of KLL with the default parameter K=200 if the asBytes() method is used, and compression=200 approximately matches KLL if serialized using asSmallBytes() method. For completeness the comparison was done at both levels of compression.
The input for the following size measurements was generated using uniform random values from 0 to 1 (Random.nextFloat() for KLL sketch and Random.nextDouble() for t-digest)
The error ε of the KLL sketch is specified as a fraction of the normalized rank of the hypothetical sorted stream of values presented to the sketch.
Suppose the sketch is queried using getRank() method to obtain the estimated rank rest of a value presented to the sketch. If the true rank of this value is rtrue, the estimated rank must be within the specified rank error ε of the true rank with 99% probability: | rest - rtrue | < ε
KLL sketch has methods to obtain normalized rank error for both single-sided (rank) and double-sided (PMF) queries. The provided rank error is the best fit to 99th percentile of empirically measured maximum error in thousands of trials.
Note that KLL sketch does not make any assumptions about the distribution of values. In principle the values do not even have to be numeric. The only requirement is the “less than” relation in the value space. The implementation under test is specialized for values of type float, but the algorithm does not take into account any “distance” in the value space. Therefore there are no error guarantees in terms of values, only the bounds are provided: lower and upper bound values such that the true quantile should be found somewhere between them with 99% probability.
The error of the t-digest is specified, similarly to KLL sketch, as a fraction of the normalized rank.
The t-digest algorithm is taking into account the distance between values, but does not provide any accuracy guarantees in the value space.
The implementation of t-digest (as of this writing) doesn’t have any methods to obtain rank error or error bounds.
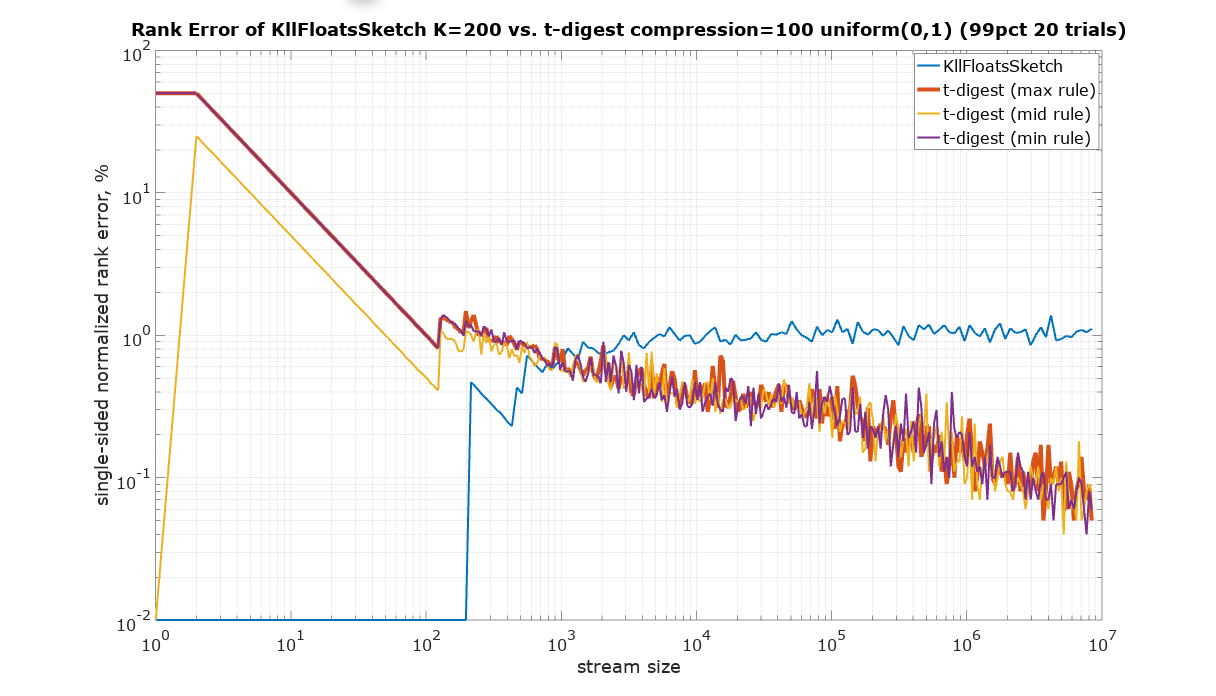
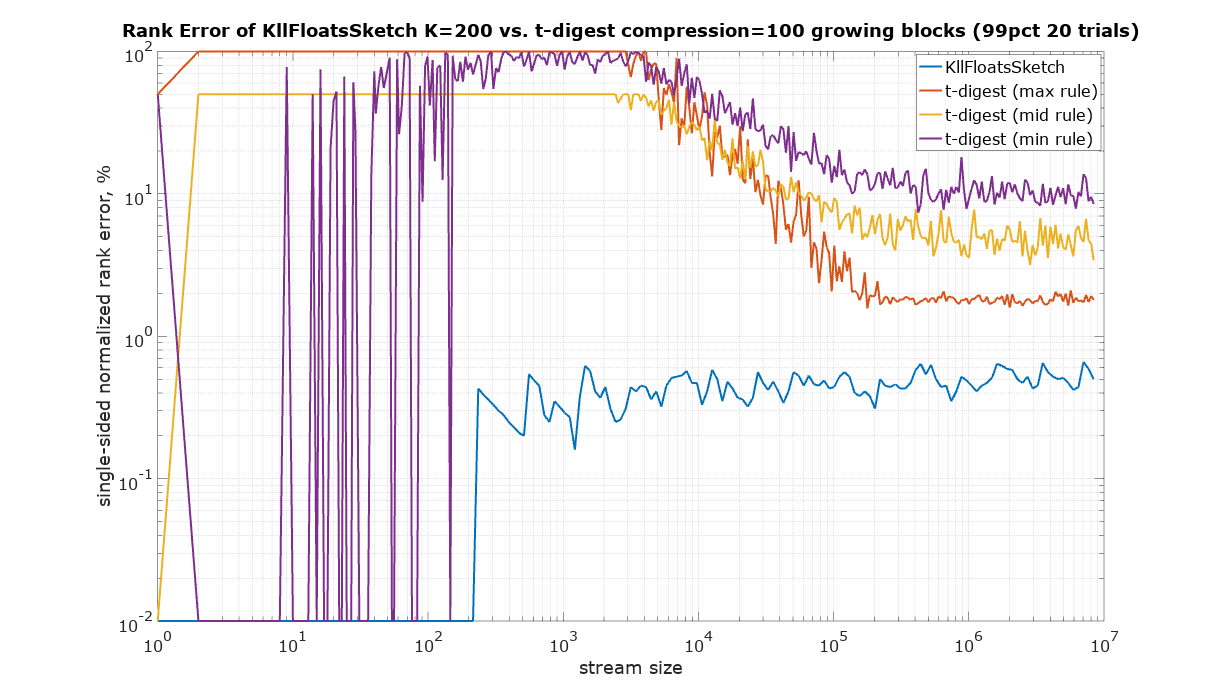
Since t-digest shows rank error up to 100%, Y axis was plotted using logarithmic scale to be able to see details in the sub 1% region. Zero values were substituted with 10-2.
The input for the following speed measurements was generated using uniform random values from 0 to 1 (Random.nextFloat() for KLL sketch and Random.nextDouble() for t-digest)
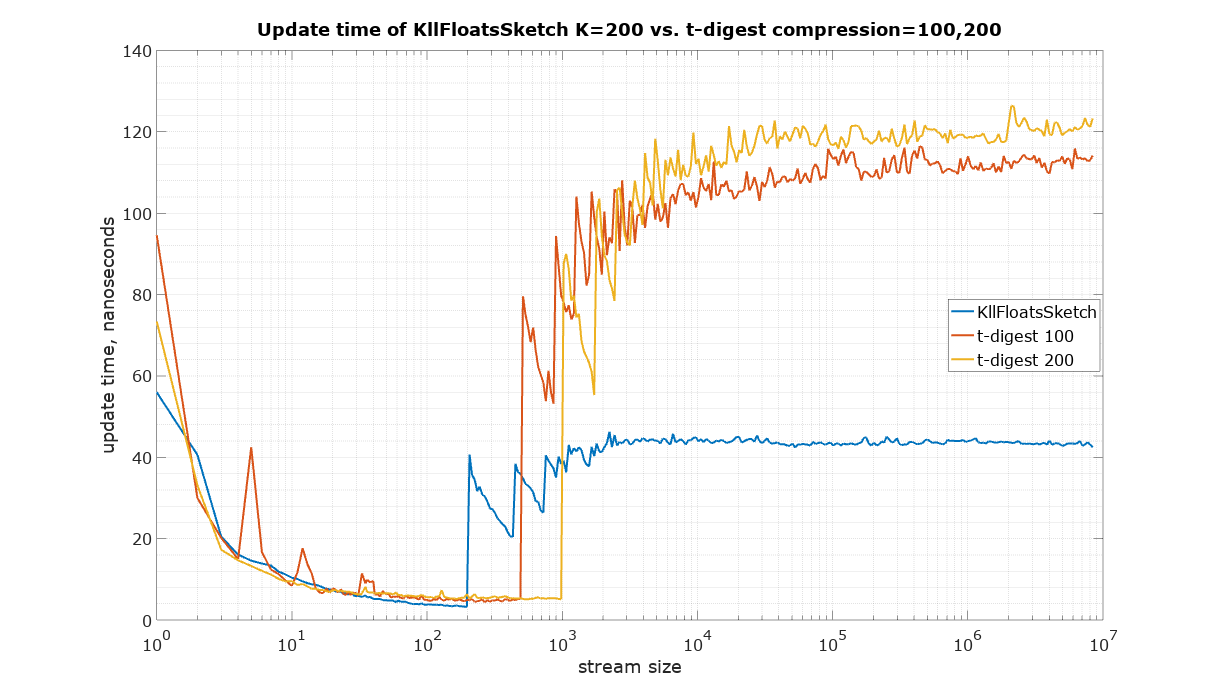
The code to reproduce these measurements is available in the Datasketches/characterization repository

